Rainbow circle in Power BI
What are we making?
My wife started studying a course in visual art two weeks ago. We were talking about colour theory one night, and it inspired me to make a colour wheel in code. I did it in JavaScript first on a HTML page, but seeing as I love Power Query so much, I thought I'd retry it to display in Power BI.
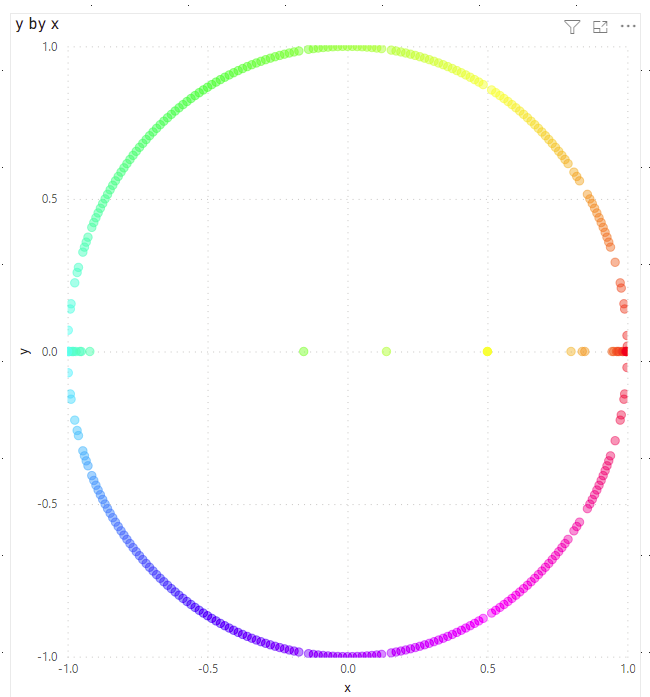
We are making this:
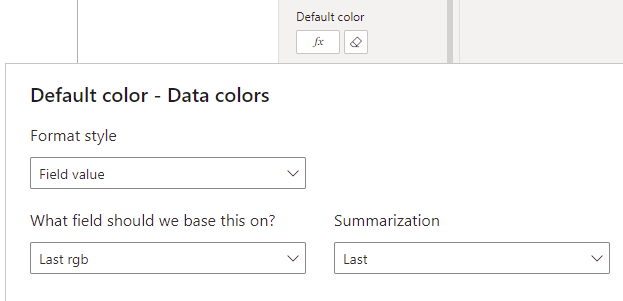
The Data Colors setting for this looks like this (it's referring to a column called rgb).
How is it done?
That "circle" is reading from a table that looks like this:
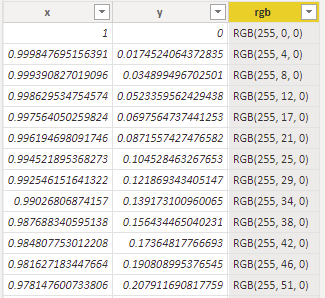
It has 360 rows, one representing one degree around a circle. The x and y columns describe the spatial position (places each dot in a circle around a Cartesian plane), and the rgb describe the colour of each dot, which goes "around" the colour wheel, from red, to yellow, green, cyan, blue, magenta, and back again.
The bulk of the work is the Power Query script that generates this table - this is the part that I really want to show off. It's really long, so you can expand the section below if you want to have a look straight away. I'll explain how it's done in the following sections.
Code
let
    /***** FUNCTIONS *****/
    between = (lower as number, index as number, upper as number) as logical =>
        lower <= index and index < upper,
    sector = (startingDegree as number, checkNumber as number) as logical =>
        between(startingDegree, checkNumber, startingDegree + 60),
    rising = (i as number) as number => i/60,
    falling = (i as number) as number => 1 - i/60,
    to256 = (colourList as list) as list =>
        List.Transform(colourList, each Number.RoundDown(_ * 255)),
    colourValueText = (whichList as number, whichPosition as number) as text =>
        Text.From(coloursIn256{whichList}{whichPosition}),
    rad = (angle as number) as number =>
        angle/180 * Number.PI,
    /***** SCRIPT *****/
    degrees = List.Buffer(sequence(360, 0)),
    red = List.Transform(
        degrees,
        each
            if sector(0, _) then 1
            else if sector(60, _) then falling(_ - 60)
            else if sector(120, _) then 0
            else if sector(180, _) then 0
            else if sector(240, _) then rising(_ - 240)
            else if sector(300, _) then 1
            else 0
    ),
    green = List.Transform(
        degrees,
        each
            if sector(0, _) then rising(_)
            else if sector(60, _) then 1
            else if sector(120, _) then 1
            else if sector(180, _) then falling(_ - 180)
            else if sector(240, _) then 0
            else if sector(300, _) then 0
            else 0
    ),
    blue = List.Transform(
        degrees,
        each
            if sector(0, _) then 0
            else if sector(60, _) then 0
            else if sector(120, _) then rising(_ - 120)
            else if sector(180, _) then 1
            else if sector(240, _) then 1
            else if sector(300, _) then falling(_ - 300)
            else 0
    ),
    colourIntensities = {red, green, blue},
    coloursIn256 = List.Transform(colourIntensities, each to256(_)),
    rgb = List.Transform(
        degrees,
        each "RGB(" & colourValueText(0, _) & ", " & colourValueText(1, _) & ", " & colourValueText(2, _) & ")"
    ),
    x = List.Transform(
        degrees,
        each Number.Cos(rad(_))
    ),
    y = List.Transform(
        degrees,
        each Number.Sin(rad(_))
    ),
    combined = Table.FromColumns(
        {
            x,
            y,
            rgb
        },
        {
            "x",
            "y",
            "rgb"
        }
    ),
    types = Table.TransformColumnTypes(
        combined,
        {
            {"x", type number},
            {"y", type number},
            {"rgb", type text}
        }
    )
in
    types
Power Query
I've divided this section into two parts, Main script and Function. I'll address the functions afterwards, because I want to focus on the logic mainly.
Main script
Here is the main code again, but just the main script (assume that all of the custom functions are valid imports):
Code
let
    /***** SCRIPT *****/
    degrees = List.Buffer(sequence(360, 0)),
    red = List.Transform(
        degrees,
        each
            if sector(0, _) then 1
            else if sector(60, _) then falling(_ - 60)
            else if sector(120, _) then 0
            else if sector(180, _) then 0
            else if sector(240, _) then rising(_ - 240)
            else if sector(300, _) then 1
            else 0
    ),
    green = List.Transform(
        degrees,
        each
            if sector(0, _) then rising(_)
            else if sector(60, _) then 1
            else if sector(120, _) then 1
            else if sector(180, _) then falling(_ - 180)
            else if sector(240, _) then 0
            else if sector(300, _) then 0
            else 0
    ),
    blue = List.Transform(
        degrees,
        each
            if sector(0, _) then 0
            else if sector(60, _) then 0
            else if sector(120, _) then rising(_ - 120)
            else if sector(180, _) then 1
            else if sector(240, _) then 1
            else if sector(300, _) then falling(_ - 300)
            else 0
    ),
    colourIntensities = {red, green, blue},
    coloursIn256 = List.Transform(colourIntensities, each to256(_)),
    rgb = List.Transform(
        degrees,
        each "RGB(" & colourValueText(0, _) & ", " & colourValueText(1, _) & ", " & colourValueText(2, _) & ")"
    ),
    x = List.Transform(
        degrees,
        each Number.Cos(rad(_))
    ),
    y = List.Transform(
        degrees,
        each Number.Sin(rad(_))
    ),
    combined = Table.FromColumns(
        {
            x,
            y,
            rgb
        },
        {
            "x",
            "y",
            "rgb"
        }
    ),
    types = Table.TransformColumnTypes(
        combined,
        {
            {"x", type number},
            {"y", type number},
            {"rgb", type text}
        }
    )
in
    types
degrees, or the backbone
Because I want to be displaying the colours as a colour wheel, I needed to have a list, going from 0 to 359, to represent a circle.
degrees = List.Buffer(sequence(360, 0))
(Here, I use a sequence function, that I describe in this blog post.)
I buffer it because it will be referred to lots of times in the script.
Defining the colours
Here, the circle is broken up into six sectors. The primary colours behave differently depending on which sector it's in. For example, red is in full colour between 300 degrees and 30 degrees, wanes between 60 and 120 degrees, is absent from 120 to 240 degrees, and rises again from 240 to 300 degrees. Here, absence to full colour goes from a scale of 0 to 1. The three primary colours are phase-shifted by 120 degrees, or a third of circle.
red = List.Transform(
    degrees,
    each
        if sector(0, _) then 1
        else if sector(60, _) then falling(_ - 60)
        else if sector(120, _) then 0
        else if sector(180, _) then 0
        else if sector(240, _) then rising(_ - 240)
        else if sector(300, _) then 1
        else 0
),
green = List.Transform(
    degrees,
    each
        if sector(0, _) then rising(_)
        else if sector(60, _) then 1
        else if sector(120, _) then 1
        else if sector(180, _) then falling(_ - 180)
        else if sector(240, _) then 0
        else if sector(300, _) then 0
        else 0
),
blue = List.Transform(
    degrees,
    each
        if sector(0, _) then 0
        else if sector(60, _) then 0
        else if sector(120, _) then rising(_ - 120)
        else if sector(180, _) then 1
        else if sector(240, _) then 1
        else if sector(300, _) then falling(_ - 300)
        else 0
),
Expressing the colours in RGB
At this stage, we have three different lists of numbers, that go from 0 to 1. In order to use this in Power BI (or, on the web in general), the primary colour values must go from 0 to 255. The following steps do this:
Firstly group all three lists into a single list.
colourIntensities = {red, green, blue}
Then, re-scale from 0-to-1 to 0-to-255:
coloursIn256 = List.Transform(colourIntensities, each to256(_))
The function colourValueText looks up the corresponding list within coloursin256 (red, green, or blue) at the specified position, and gives the 256-scale number. The next step makes use of this function to construct the RGB text values.
rgb = List.Transform(
    degrees,
    each "RGB(" & colourValueText(0, _) & ", " & colourValueText(1, _) & ", " & colourValueText(2, _) & ")"
)
// e.g. "RGB(255, 210, 0)"
Circle positions
We now have a list og 360 colours values, in the format "RGB(X, Y, Z)". We now need the spatial positions of where each dot is going. Given that we started with degrees, getting x and y coordinates is fairly easy using basic trignonometric functions. I have to use an intermediate function rad to convert from degrees to radians.
x = List.Transform(
    degrees,
    each Number.Cos(rad(_))
),
y = List.Transform(
    degrees,
    each Number.Sin(rad(_))
)
Compose the final table
All that's left is to put everything together!
combined = Table.FromColumns(
    {
        x,
        y,
        rgb
    },
    {
        "x",
        "y",
        "rgb"
    }
),
types = Table.TransformColumnTypes(
    combined,
    {
        {"x", type number},
        {"y", type number},
        {"rgb", type text}
    }
)
Functions
between
This is a way of expressing statements like 30 <= i < 60. Note that the upper bound is exclusive.
    between = (lower as number, index as number, upper as number) as logical =>
        lower <= index and index < upper
sector
This is to check whether the angle in question falls within a particular 60-degree sector, defined by the starting angle.
    sector = (startingDegree as number, checkNumber as number) as logical =>
        between(startingDegree, checkNumber, startingDegree + 60)
rising
rising = (i as number) as number => i/60
falling
falling = (i as number) as number => 1 - i/60
to256
Transforms the list of colours (with colour values ranging between 0 and 1) to a list that ranges between 0 and 255. Decimal numbers are rounded down to the nearest integer - Power BI won't be able to interpret the colour otherwise.
    to256 = (colourList as list) as list =>
        List.Transform(colourList, each Number.RoundDown(_ * 255))
colourValueText
This picks out the 256-scale colour value from one of the lists in coloursIn256, and converts it to a text value.
    colourValueText = (whichList as number, whichPosition as number) as text =>
        Text.From(coloursIn256{whichList}{whichPosition})
rad
Converts degrees to radians. The trigonometric functions in Power Query accept radians only.
    rad = (angle as number) as number =>
        angle/180 * Number.PI